
Time Series & Distribution
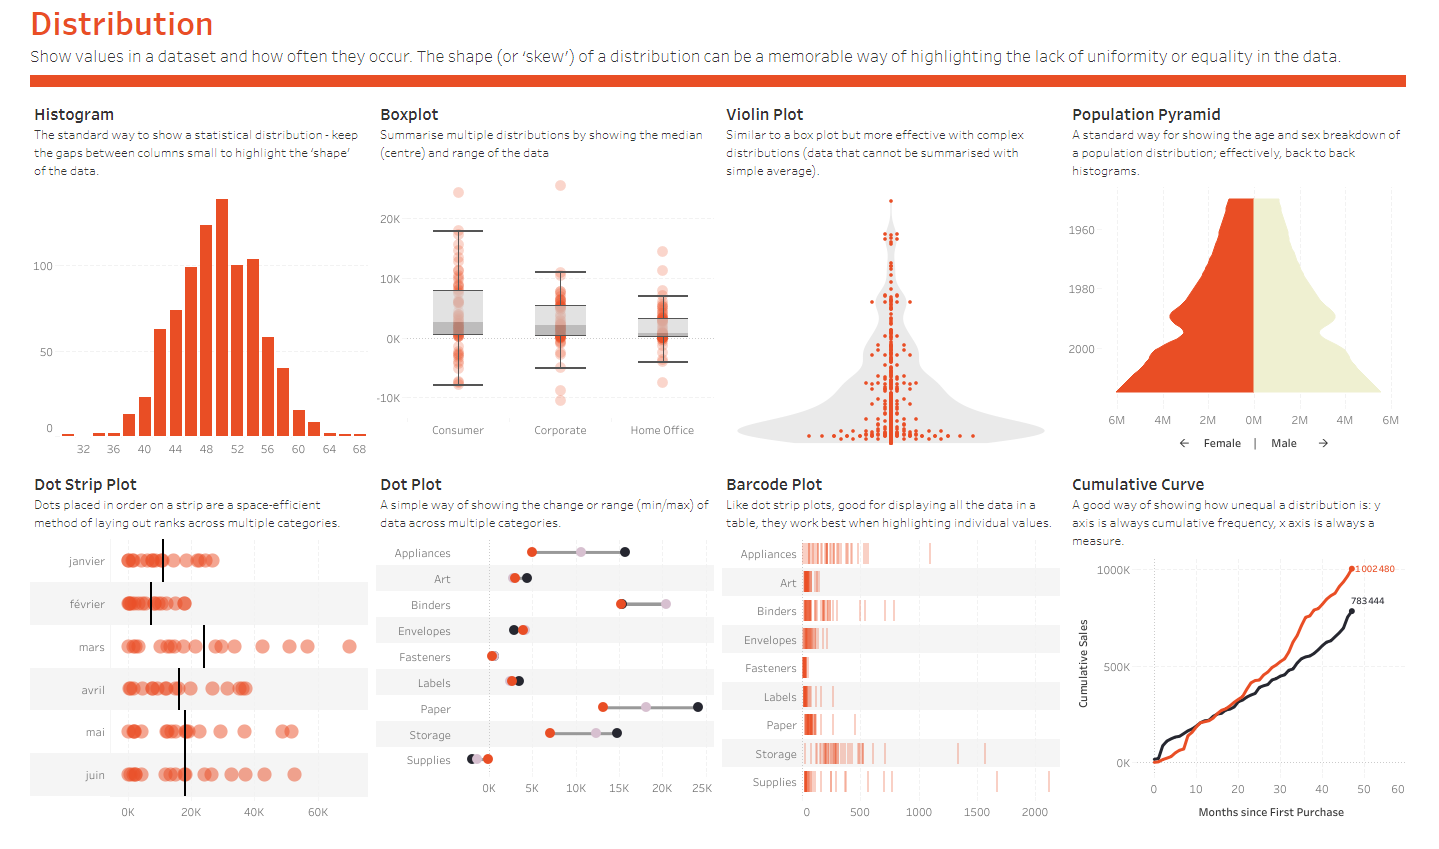
This type of visualization show values in a dataset and how often they occur.
Check out the full interactive visual vocabulary.
CREATED BY (c) Andy Kriebel | @VizWizBI
INSPIRED BY: FT Graphics: Alan Smith; Chris Campbell; Ian Bott; Liz Faunce; Graham Parrish; Billy Ehrenberg; Paul McCallum; Martin Stabe